
Google Maps now helps users check air quality levels across many cities in northern India. Residents can use the dedicated Air Quality layer to see real-time pollution data before stepping outdoors. This feature uses a simple colour-coded scale to show how clean the air is in your specific area.
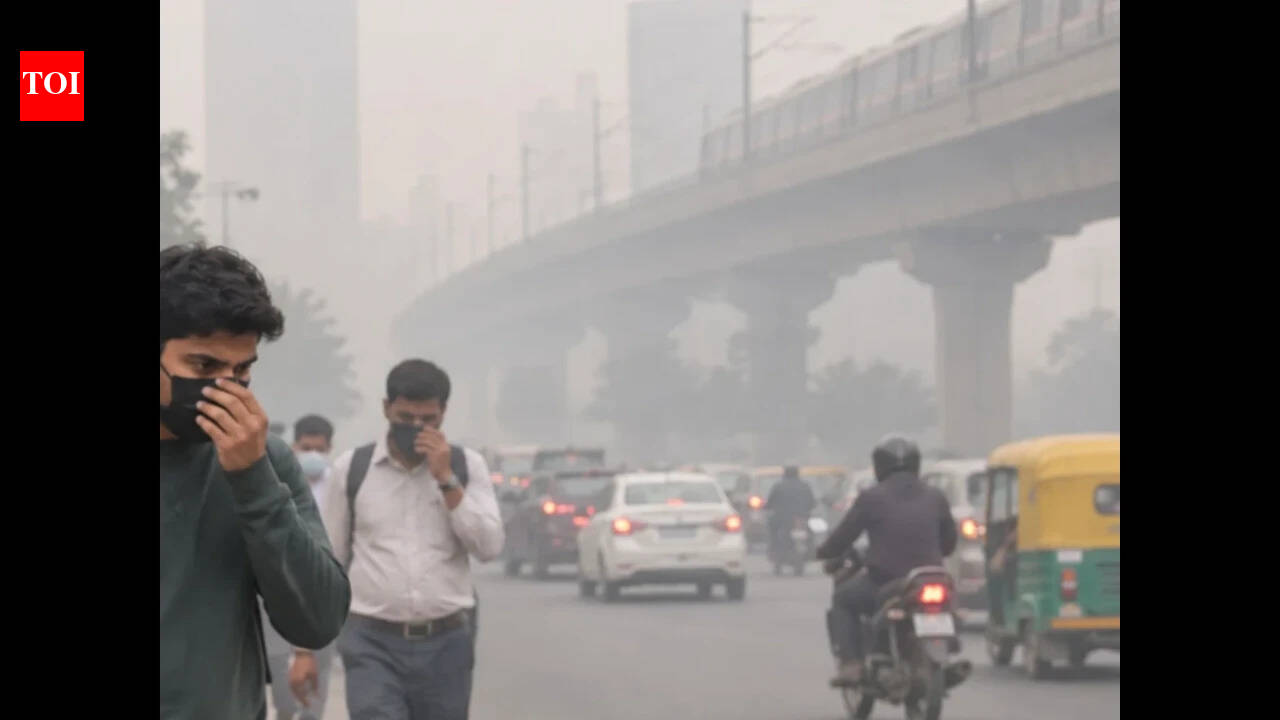
As winter sets in across northern India, several cities in the region continue to battle poor air quality levels. Cities including Delhi, Noida, Gurugram, Ghaziabad, Faridabad and parts of Punjab and Haryana often witness a sharp rise in pollution during this period due to a combination of vehicular emissions, industrial pollution, construction dust and unfavourable weather conditions that trap pollutants closer to the ground. With many residents checking air quality levels before stepping outdoors, having quick access to reliable AQI information has become increasingly important. One of the easiest ways to monitor air quality is through Google Maps. The navigation platform includes a dedicated Air Quality layer that displays real-time air quality information, helping users understand pollution levels in their area and plan their activities accordingly.
What the air quality layer shows
The layer sits on top of the normal map and uses a simple colour-coded scale to show how clean or dirty the air is in a supported area. Coverage spans more than 40 countries, so you can check Indian cities as well as places such as Beijing and New York. Google draws on air quality data from different sources depending on the region. For example, in the US it has used information from sources including the Environmental Protection Agency and PurpleAir sensors.
Why the feature is useful
The Air Quality layer can help users:
*Plan morning walks and outdoor workouts*Check pollution levels before travelling*Monitor air quality during winter smog conditions*Protect children, senior citizens and people with respiratory issues*Decide whether masks or other precautions may be necessary
How to check air quality on your phone
1.Update and open Google Maps. Make sure the app is updated to the latest version on your Android or iOS device so the AQI layer is available.
2.Pick your location. Search for a city, neighbourhood, landmark or address, or tap the location button to see your current position.3.Tap the Layers icon. It looks like a stack of squares and sits next to the search box. On some versions, it is in the top right corner of the screen.
4.Choose "Air quality". The AQI layer will appear on the map, coloured according to the pollution level.5.Tap the map for details. Tapping an area or a station bubble brings up its reading and a fuller report for that spot.
How to check on a computer
Open maps.google.com in your browser and search for the place you want. Click the Layers button at the bottom left of the map, and select Air quality from the options. The steps are similar to those on mobile.
How to read the colours
The layer uses colour to show how healthy the air is. A green bubble indicates healthy air, an orange bubble signifies unhealthy air, and a red bubble represents extremely unhealthy air. Look at the number and the category label too, because the same colour can mean different ranges in different countries' AQI systems.