
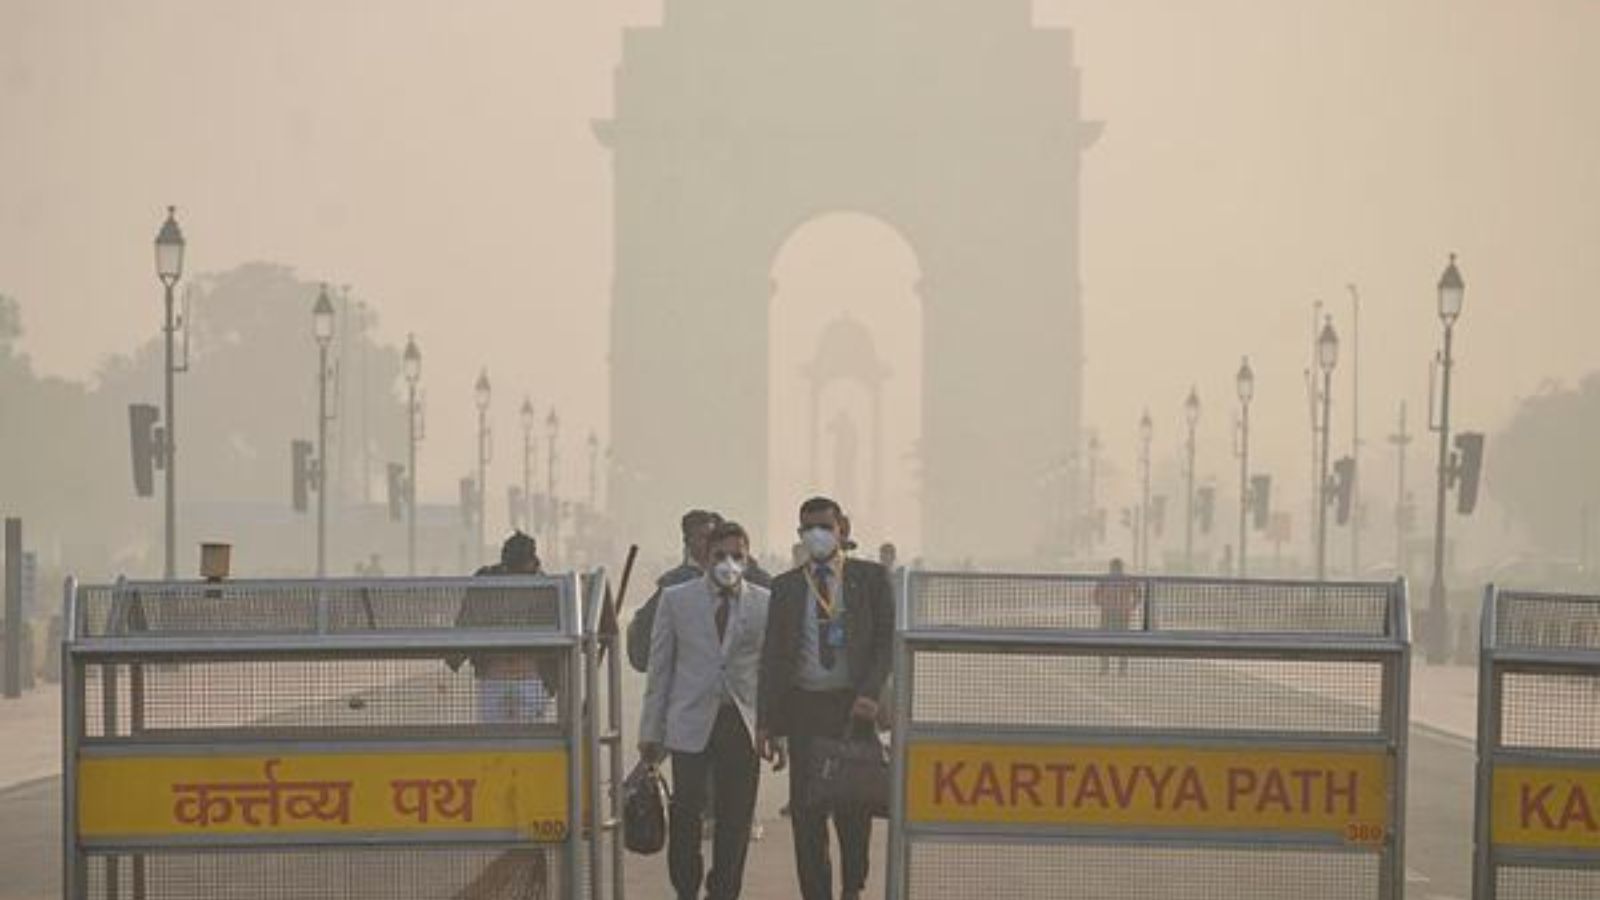
Delhi’s average AQI fell to 102 this September, the lowest in five years. However, official data showed that concentrations of PM2.5 and PM10 actually rose compared to last year. Experts said the AQI is not a simple average, so these specific pollutants can increase even when the overall index falls.
Delhi's air appeared to improve this September. The city's average Air Quality Index, or AQI - a numerical index that translates concentrations of multiple air pollutants into a single measure of air quality - fell to 102, its lowest September average in five years, according to official data from the Commission for Air Quality Management.
But measurements of two specific key pollutants - PM2.5 and PM10 - tell a different story.
The concentrations of PM2.5 and PM10, two of the pollutants most closely associated with harmful air pollution, slightly increased this September compared with last year, according to an analysis of data from the Central Pollution Control Board (CPCB).
At first glance, the two sets of numbers appear contradictory. But they measure different aspects of air quality, and the difference largely lies in how the AQI is calculated and how the data is being compared.
AQI is not an average of pollutants
The National Air Quality Index classifies air quality into six categories: Good (0-50), Satisfactory (51-100), Moderately polluted (101-200), Poor (201-300), Very Poor (301-400) and Severe (401-500). With an average AQI of 102, Delhi's air in September fell into the Moderately polluted category.
The Air Quality Index is a composite measure based on concentrations of individual pollutants, including PM2.5, PM10, nitrogen dioxide, ozone, sulphur dioxide, carbon monoxide, ammonia and others.
For each pollutant, a sub-index is calculated based on its concentration. The overall AQI is determined by the pollutant with the highest sub-index on a given day.
This means the AQI is not obtained by simply adding or averaging the concentrations of PM2.5, PM10 and gaseous pollutants.
As a result, a rise in PM2.5 does not necessarily mean the AQI will rise by a corresponding amount. If PM2.5 increases but its sub-index remains below that of another pollutant, the overall AQI can remain unchanged or even fall if the dominant pollutant is at a lower level. The same applies to PM10.
What happened in September?
The analysis of the CPCB data for September shows that the average PM10 concentration rose from 104 micrograms per cubic metre in September 2025 to 106 µg/m³ this year. PM2.5 increased from 35 µg/m³ to 39 µg/m³.
Delhi's September averages of 106 µg/m³ for PM10 and 39 µg/m³ for PM2.5 therefore fall into the Moderately polluted range for PM10 and the Satisfactory range for PM2.5.
At the same time, the monthly averages of NO2 and ozone were lower than they were in September 2025.
CAQM, meanwhile, reported that Delhi's September average AQI was 102, compared with 105 in both 2025 and 2024, 108 in 2023 and 104 in 2022.
So, the decline in the monthly AQI does not mean that concentrations of every pollutant declined. It means the composite AQI outcome was lower.
Why does the AQI not move with PM2.5 alone?
A rise in PM2.5 does not always mean the overall AQI will rise. That is because the AQI is based on several pollutants, and the pollutant with the highest sub-index determines the final AQI. So, even if PM2.5 or PM10 goes up, the overall AQI can still fall if another pollutant that was driving the index drops significantly.
"If PM2.5 rises from one concentration to another, its sub-index also rises. But if ozone or another pollutant still has the higher sub-index, the overall AQI is controlled by that pollutant. Conversely, if the pollutant that was previously driving the AQI falls substantially, the overall AQI can decline even if PM2.5 or PM10 rises," explained Sunil Dahiya, lead analyst and founder at Delhi-based think tank Envirocatalysts.
He also pointed out that month-to-month variations in average AQI can affect the cumulative average when a longer period, such as January to September, is compared with previous years. Even relatively small differences in individual months can result in a slight change in the overall average when aggregated over nine months.
On the scientific rationale behind such comparison, a CAQM spokesperson said the commission's evaluation uses a comprehensive approach, looking at cumulative trends from January through the month under review, including monthly averages and the number of days in different AQI categories as a standard practice in its analysis reports.
For January 1 to September 28, Delhi recorded 194 days with an average AQI below 200, the highest count in the corresponding period of the last five years. The figure was 187 in 2025, 188 in 2024, 193 in 2023 and 146 in 2022, the Commission noted in a statement Wednesday.
The number of days in the Poor to Severe+ categories also fell to 79, compared with 86 each in 2025 and 2024, 80 in 2023 and 127 in 2022.
The cumulative PM2.5 average for January 1 to September 28 was 69 µg/m³, the same as in 2025 and below 81 µg/m³ in 2024, 73 µg/m³ in 2023 and 80 µg/m³ in 2022. September is also a transition period as the city enters its post-monsoon phase. Pollution concentrations in Delhi can change sharply with weather conditions including high wind speed, rainfall and humidity.